


Data analysis is crucial to any marketing strategy The RFM model is a marketing technique used to segment customers based on their importance to the business.
If you are interested in this metric, and how to use it to improve the results of your marketing plan, keep reading!
What is the RFM analysis?
RFM (Recency, Frequency, Monetary) analysis is a customer segmentation technique in which their behavior is analyzed. This tool is widely used in marketing as it allows you to increase the number of sales in ecommerce.
Through the RFM analysis, it is possible to know which customers we are most interested in impacting with a campaign, taking into account their last purchase, how often they buy or how much money they spend.
This technique is based on data, hence the importance of having a tool that helps you break down and organize customer data. The more specific and correct the data, the greater the probability of success.
Thanks to it, it is very easy to know which are the most profitable clients or how to promote the most lagging ones.
By doing an RFM analysis, it is possible to send personalized campaigns to high-value customers, or who are just in a moment of change in their relationship with the store, which has great benefits for e-commerce stores. The RFM model allows you to customize campaigns, improve the conversion rate and unit economy, which ends up resulting in increased revenue and profits.
From the point of view of customers, it is also a very positive model, it prevents them from receiving advertising or offers that do not suit their needs or tastes. The image they have of a company improves the more personalized the information and promotions they receive. They feel that their value in the company is greater, so the esteem of the company also increases.
What’s the objective?
Like any strategy, the main function of the RFM model is to increase the revenue of the brand. But it has other goals like:
1.Segment customers in order to know their behavior and facilitate the interpretation of the data obtained.
2. Know the abandonment rate. It is not only essential to know who the most loyal customers are, but also to know what type of customers are most likely to abandon the store. With this data, campaigns can be launched to try to retain them.
3. Improve the response rate, identifying users based on their characteristics, campaigns can be created to meet their needs. Managing to increase their response to campaigns.
4. Increase in the conversion rate. This is possible thanks to all the information obtained from each client.
How to do the segmentation based on the RFM model?
Following the steps of this tool allows for advanced user segmentation. It will help to impact them in a more effective way, knowing in detail what type of client we are addressing.
To be able to do this segmentation, each of the variables must be established, the importance of these can change depending on the business.
The variables that we must take into account are:
-Recency: measures the time that has elapsed since the last purchase. Customers who have recently purchased are more likely to make new purchases. Depending on the business, a threshold must be established to be able to take referential values and carry out the analysis based on them. The dynamics of time are personal to each business.
– Frequency: This takes into account customers who have purchased more products in a set period of time. The more products a customer has bought, the more likely they are to continue buying compared to those who have made fewer purchases. In this case, the life cycle of a product must be taken into account, as the number of purchases will be based on this.
-Monetary value: this is variable in each model, depending on the type of business. The activity of the company must be taken into account to establish the monetary value; selling pencils is not the same as selling cars. The former will have a much lower monetary value per customer than the latter. The higher the monetary value of the customer, the higher the probability of purchase.
In all these variables, it is essential to establish a personalized threshold for each business that allows customers to be segmented according to whether they meet the conditions or not. It is therefore very important to have a tool that breaks down every detail of the data obtained from customers and allows realistic thresholds to be established. Binnacle Data provides quality data to reach the best conclusions.
¿Cómo se presentan los datos Binnacle Data?
Binnacle Data is an analytical solution that allows you to store all your data in one place. It crosses the main sources of information to give complete and quality results, making the data accessible to all the teams in the company in a secure way.
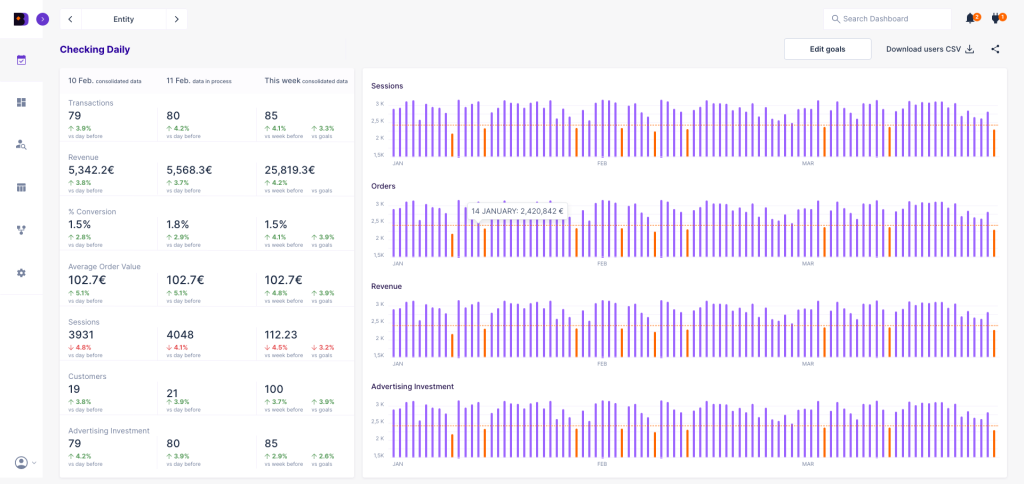
As you can see in this example, the Binnacle Data interface analyzes the different data and records them in an orderly and very visual way. At a glance you can identify the most important values.
Some of the data analyzed by this tool are:
-Customer behaviour
-Sales
-Catalogue and inventory
-Shipping and logistics
-Advertising and SEO
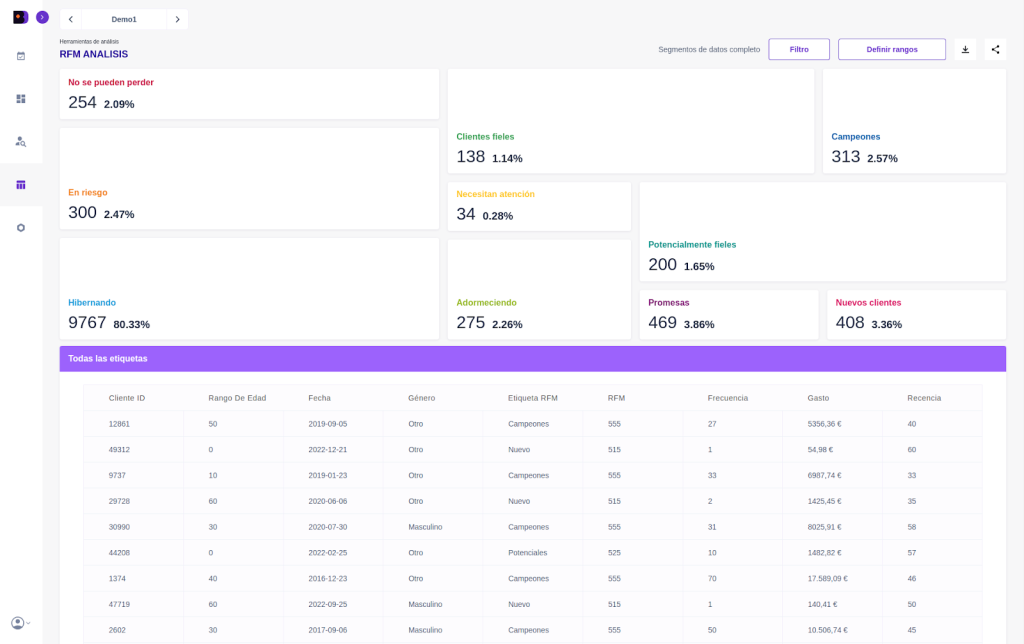
In addition, Binnacle Data has a proprietary tool that allows the execution of RFM analysis in a simple and direct way from the data collected from the business.
As can be seen in the figure, Binnacle Data shows customer segmentation in a simple, interactive and very visual way. t allows you to modify the Frequency, Recency and monetary value thresholds to customise the analysis for each business and export the segmented customer list to activate this data in other marketing tools, such as email marketing solutions.
It also allows each of the customer segments to be broken down to obtain more specific data, as shown in the following figures.
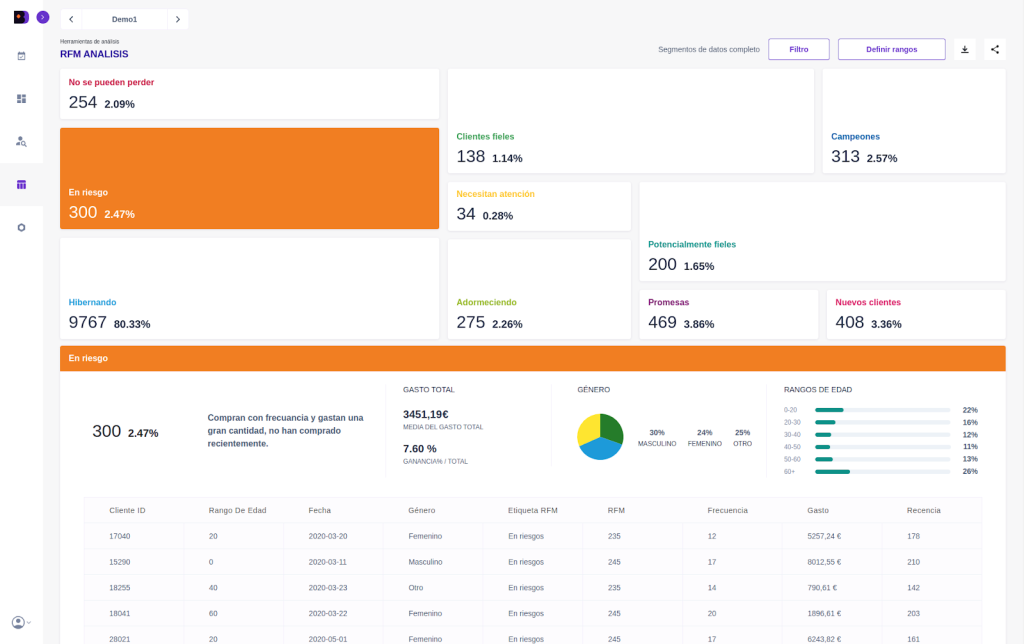
With a single click on the desired segment, a string of information about those customers is displayed. In this way you can analyse each group in more detail and obtain detailed information about their socio-demographic and interaction with the business.
The data is automatically updated every day so you will always have up-to-date and accurate information.
Finally, for an even more personalized experience, it allows you to set the ranges of each of the variables based on the objectives and goals of each client.
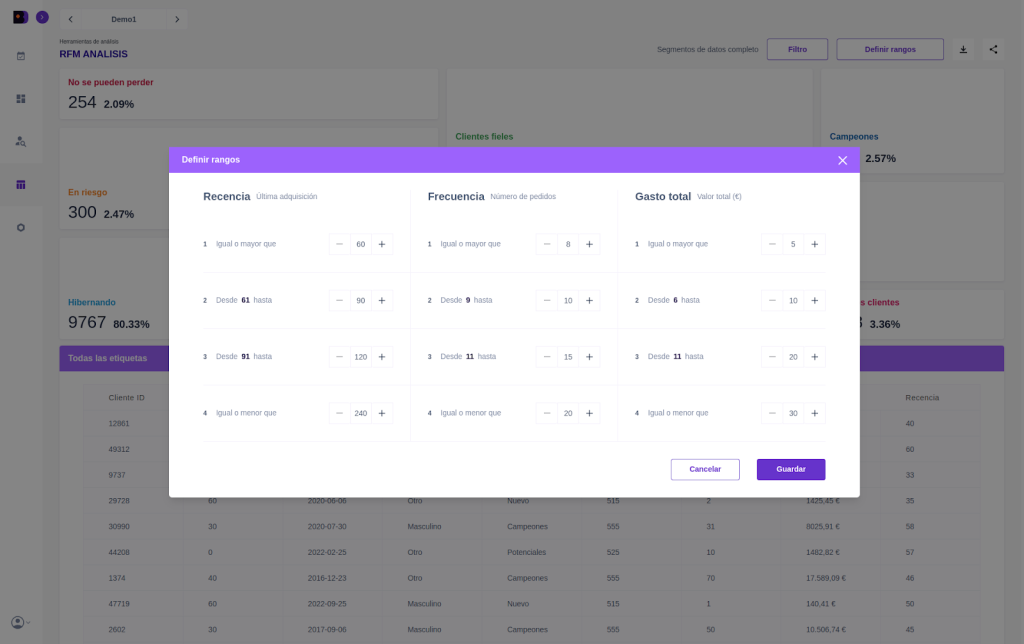
En esta figura se muestra cómo personalizar y adaptar las variables en base a las necesidades.
If you want to find out how to implement this tool in your business or if you have any questions please contact us! 🙂


